
prokube 1.9: Our Own UI, Agents, and Agent Gateway
Our own UI, the first agent features, and Agent Gateway with self-service API keys. Also, why this release is not called 2.0.
prokube 1.9 is out. I think it is the first release where you can clearly see that prokube is a product of its own, and not only a collection of the great open-source tools we ship with it.
Honestly, I wanted to call it 2.0. New UI, new gateway, new docs, and the platform looks different from the very first screen. My colleagues reminded me that semantic versioning exists, and that "it looks very different now" is not a breaking change. So it's 1.9. I'm still a bit sad about it.
Useful links
- prokube 1.9: documentation, Agents, Agent Gateway, API Keys
- Examples: prokube/examples
- Upstream: kagent, agentgateway, Model Context Protocol
Why we built our own UI
Up to 1.8, the first thing you saw after logging in was the Kubeflow Central Dashboard. Behind it were platform components, such as Pipelines, MLflow and a few more. Each with its own UI and its own idea of where buttons should be and how they should look.
Everything that did not fit into those UIs ended up somewhere else: in a small
admin CLI or in a docs page asking you to run kubectl.
Our internal tracker shows how long some of this had been bothering us. Here are some of the issues with the old, Kubeflow-based setup that we were finally able to close with the new UI:
- Change the logo, name and maybe the color of the Kubeflow UI. Judging by the number of questions we got, this was our customers' top priority. The logo was hard-coded in the Central Dashboard, so changing it meant building and maintaining our own dashboard image.
- Kubeflow links look unclickable. A dependency upgrade in Kubeflow accidentally switched the main theme color to a pale blue, so most links and buttons looked disabled. Kubeflow shipped it in at least three releases in a row, and every single client asked us about it. The upstream fix was one line, but for us, it meant rebuilding the Central Dashboard, Katib, Pipelines and PVC viewer images. With our own UI, a bug like this means rebuilding one image.
- Remove the Contributors page from the Central Dashboard. We manage workspace members through Keycloak, but the dashboard let users add contributors on their own. Hiding the button also required a custom image. I tried to block it with an Istio policy instead. It worked, but only after a page refresh.
- Pulling from private image registries. Credentials had to be set up by an admin from a terminal. Users can now add them directly in the UI.
Some of these had been open for quite a while, because every fix meant patching an upstream UI and keeping that patch alive across upgrades. Introducing our UI spared us that maintenance burden.
Still, fixing old bugs is only half of it. With our own UI, we can finally put everything in one place and build features that did not fit anywhere before.
One place for the whole workspace
The prokube UI was already available in 1.8, but in 1.9 it becomes the default entry point. All services are in one sidebar, from Labs with JupyterLab, VS Code and RStudio to model serving and pipelines. Everything is organized in workspaces, the separate spaces where each team keeps its own resources, and the selector at the top switches between them.
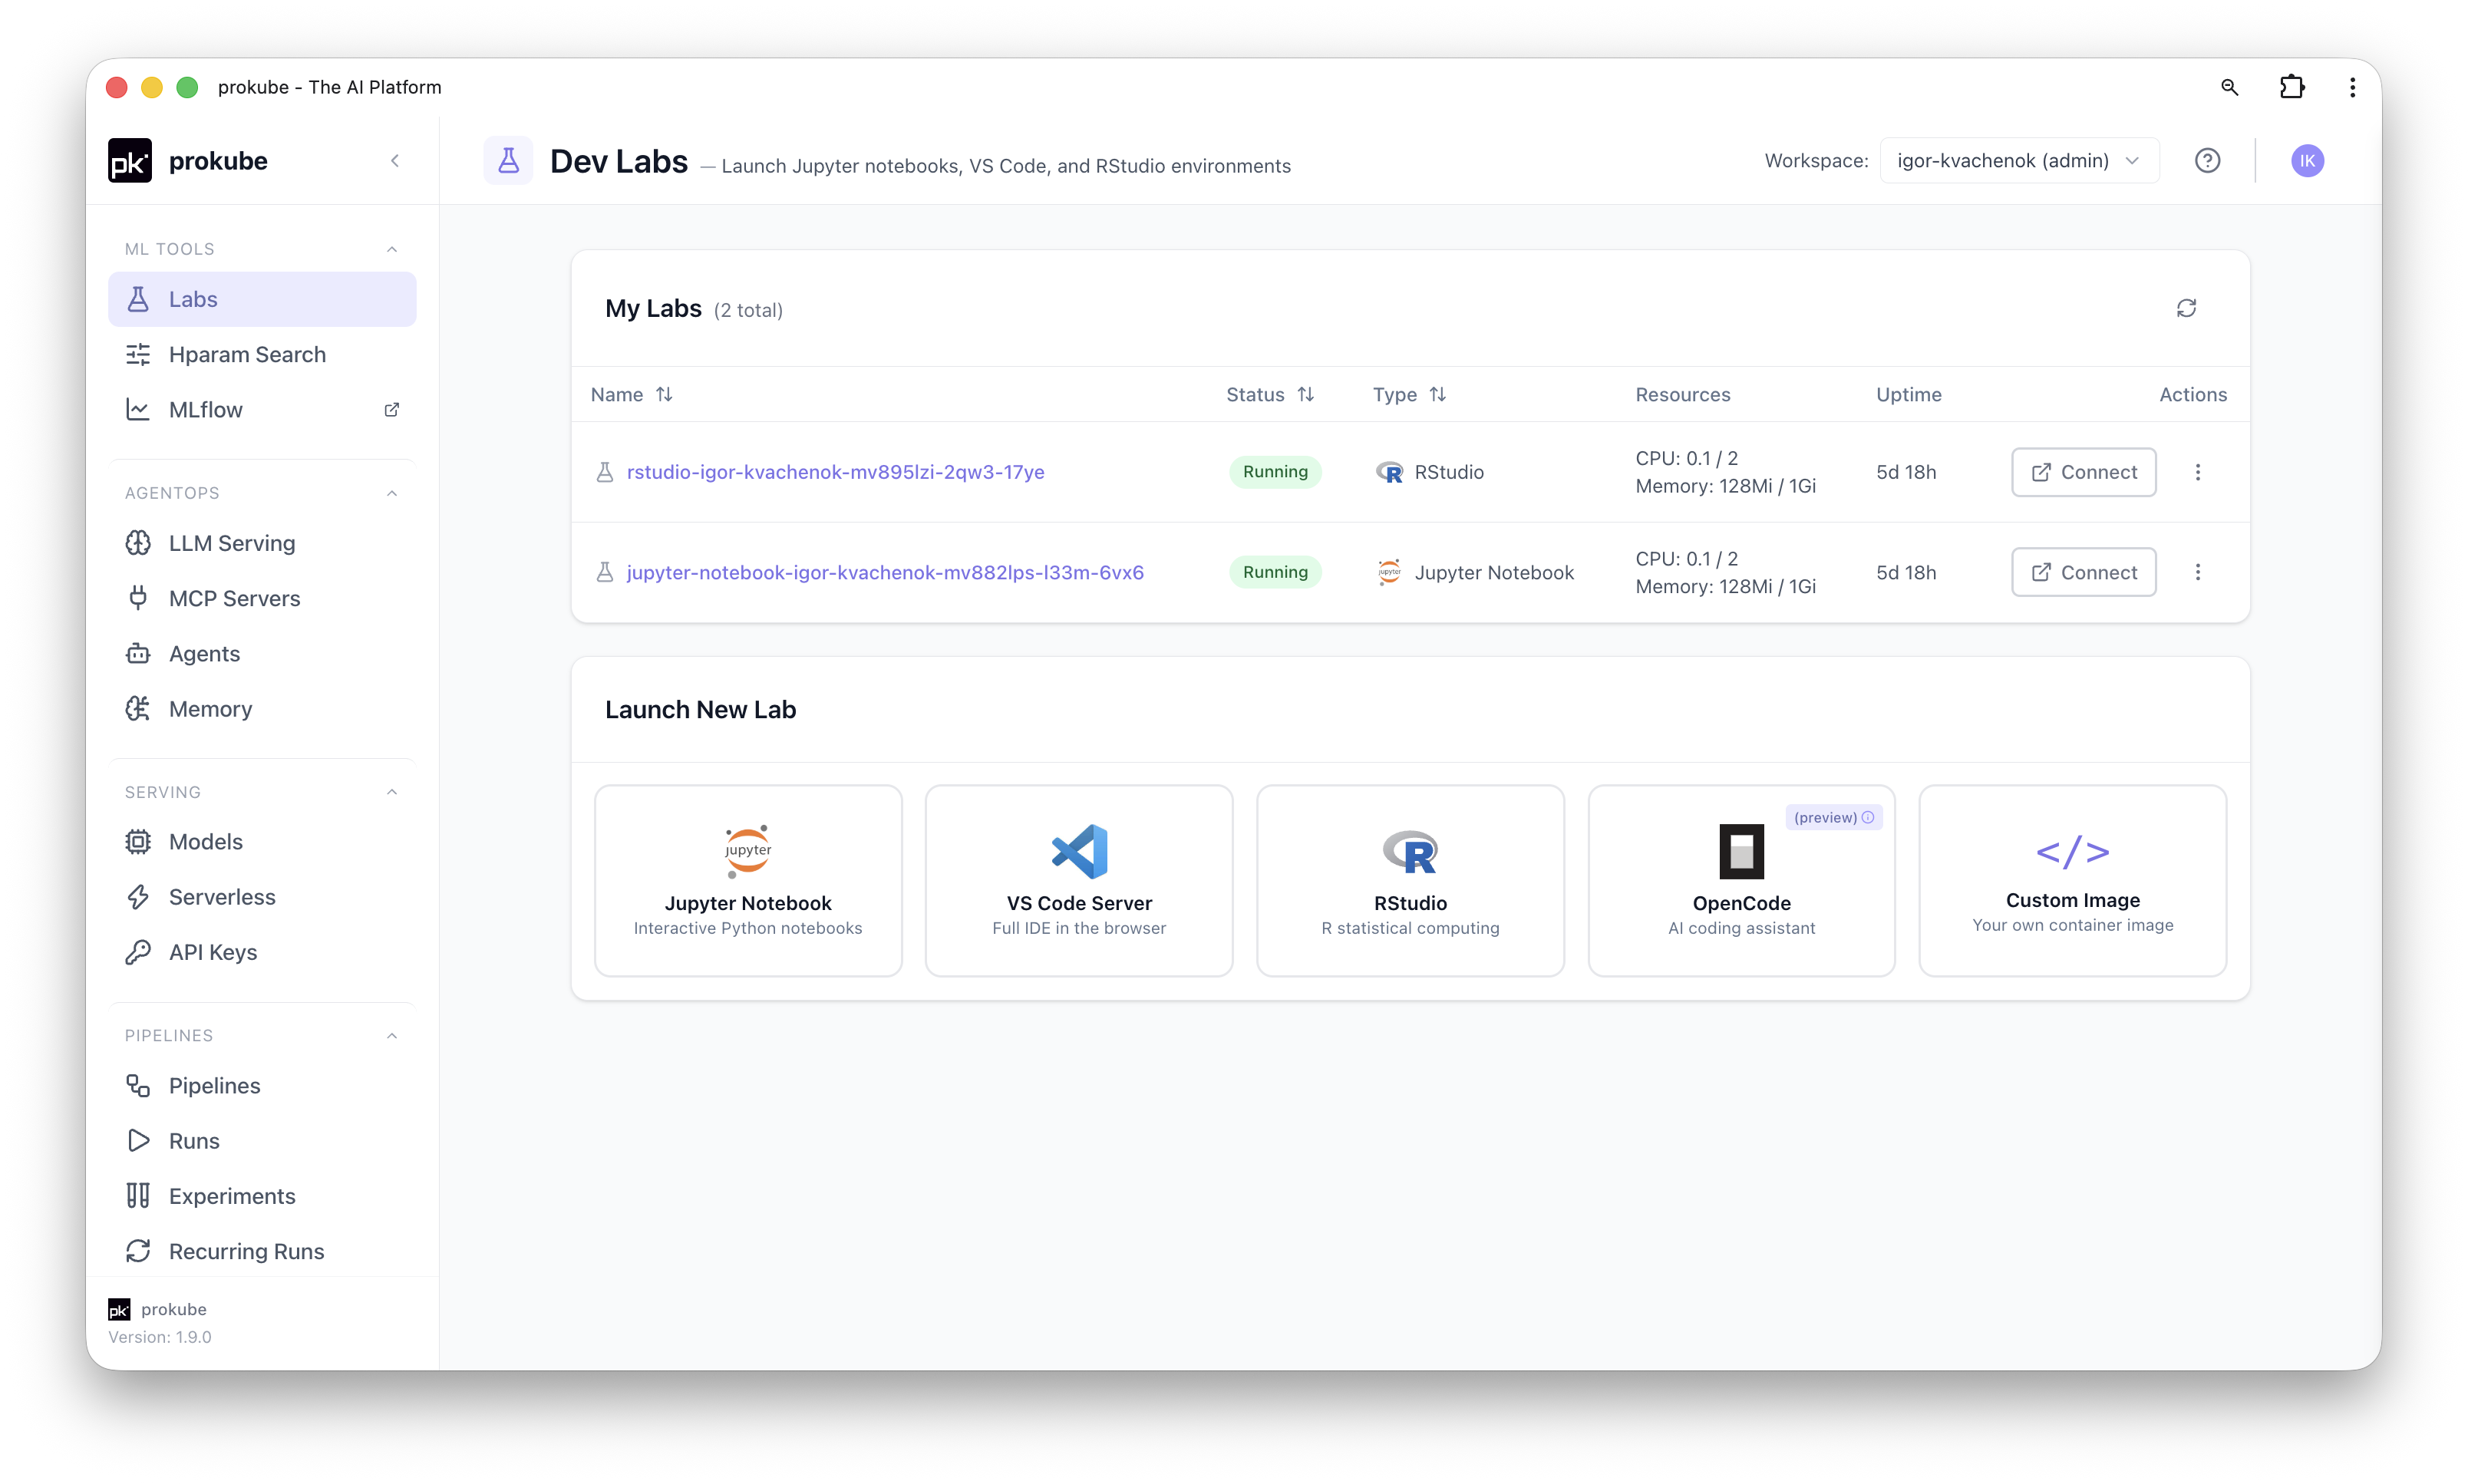
You no longer have to recreate a Lab just to change its image, resources or volumes. You can also still read pipeline logs after the pods are gone. And to deploy a KServe model, you pick the model files from S3 or directly from your workspace's MLflow.
The open-source tools underneath are still there. Kubeflow, KServe and MLflow do the actual work, and everything the UI creates is a regular Kubernetes resource. Most create dialogs also have a YAML editor, so if you prefer writing manifests, nothing stops you.
Admins got some love too. Users, groups and workspaces are now managed in the same UI, with new Editor and Viewer roles, and egress profiles control what a workspace can reach on the network. In Platform Settings, you can change branding and hide modules without a redeploy. Yes, changing the logo is now a setting.

Goodbye, pkadmin
The small admin CLI I mentioned above was called pkadmin. For a long time, it
handled routine tasks like creating kubeconfigs and cleaning up finished
Kubeflow Pipelines pods. It did its job, but you needed a terminal and the
right setup for things that should take one click.
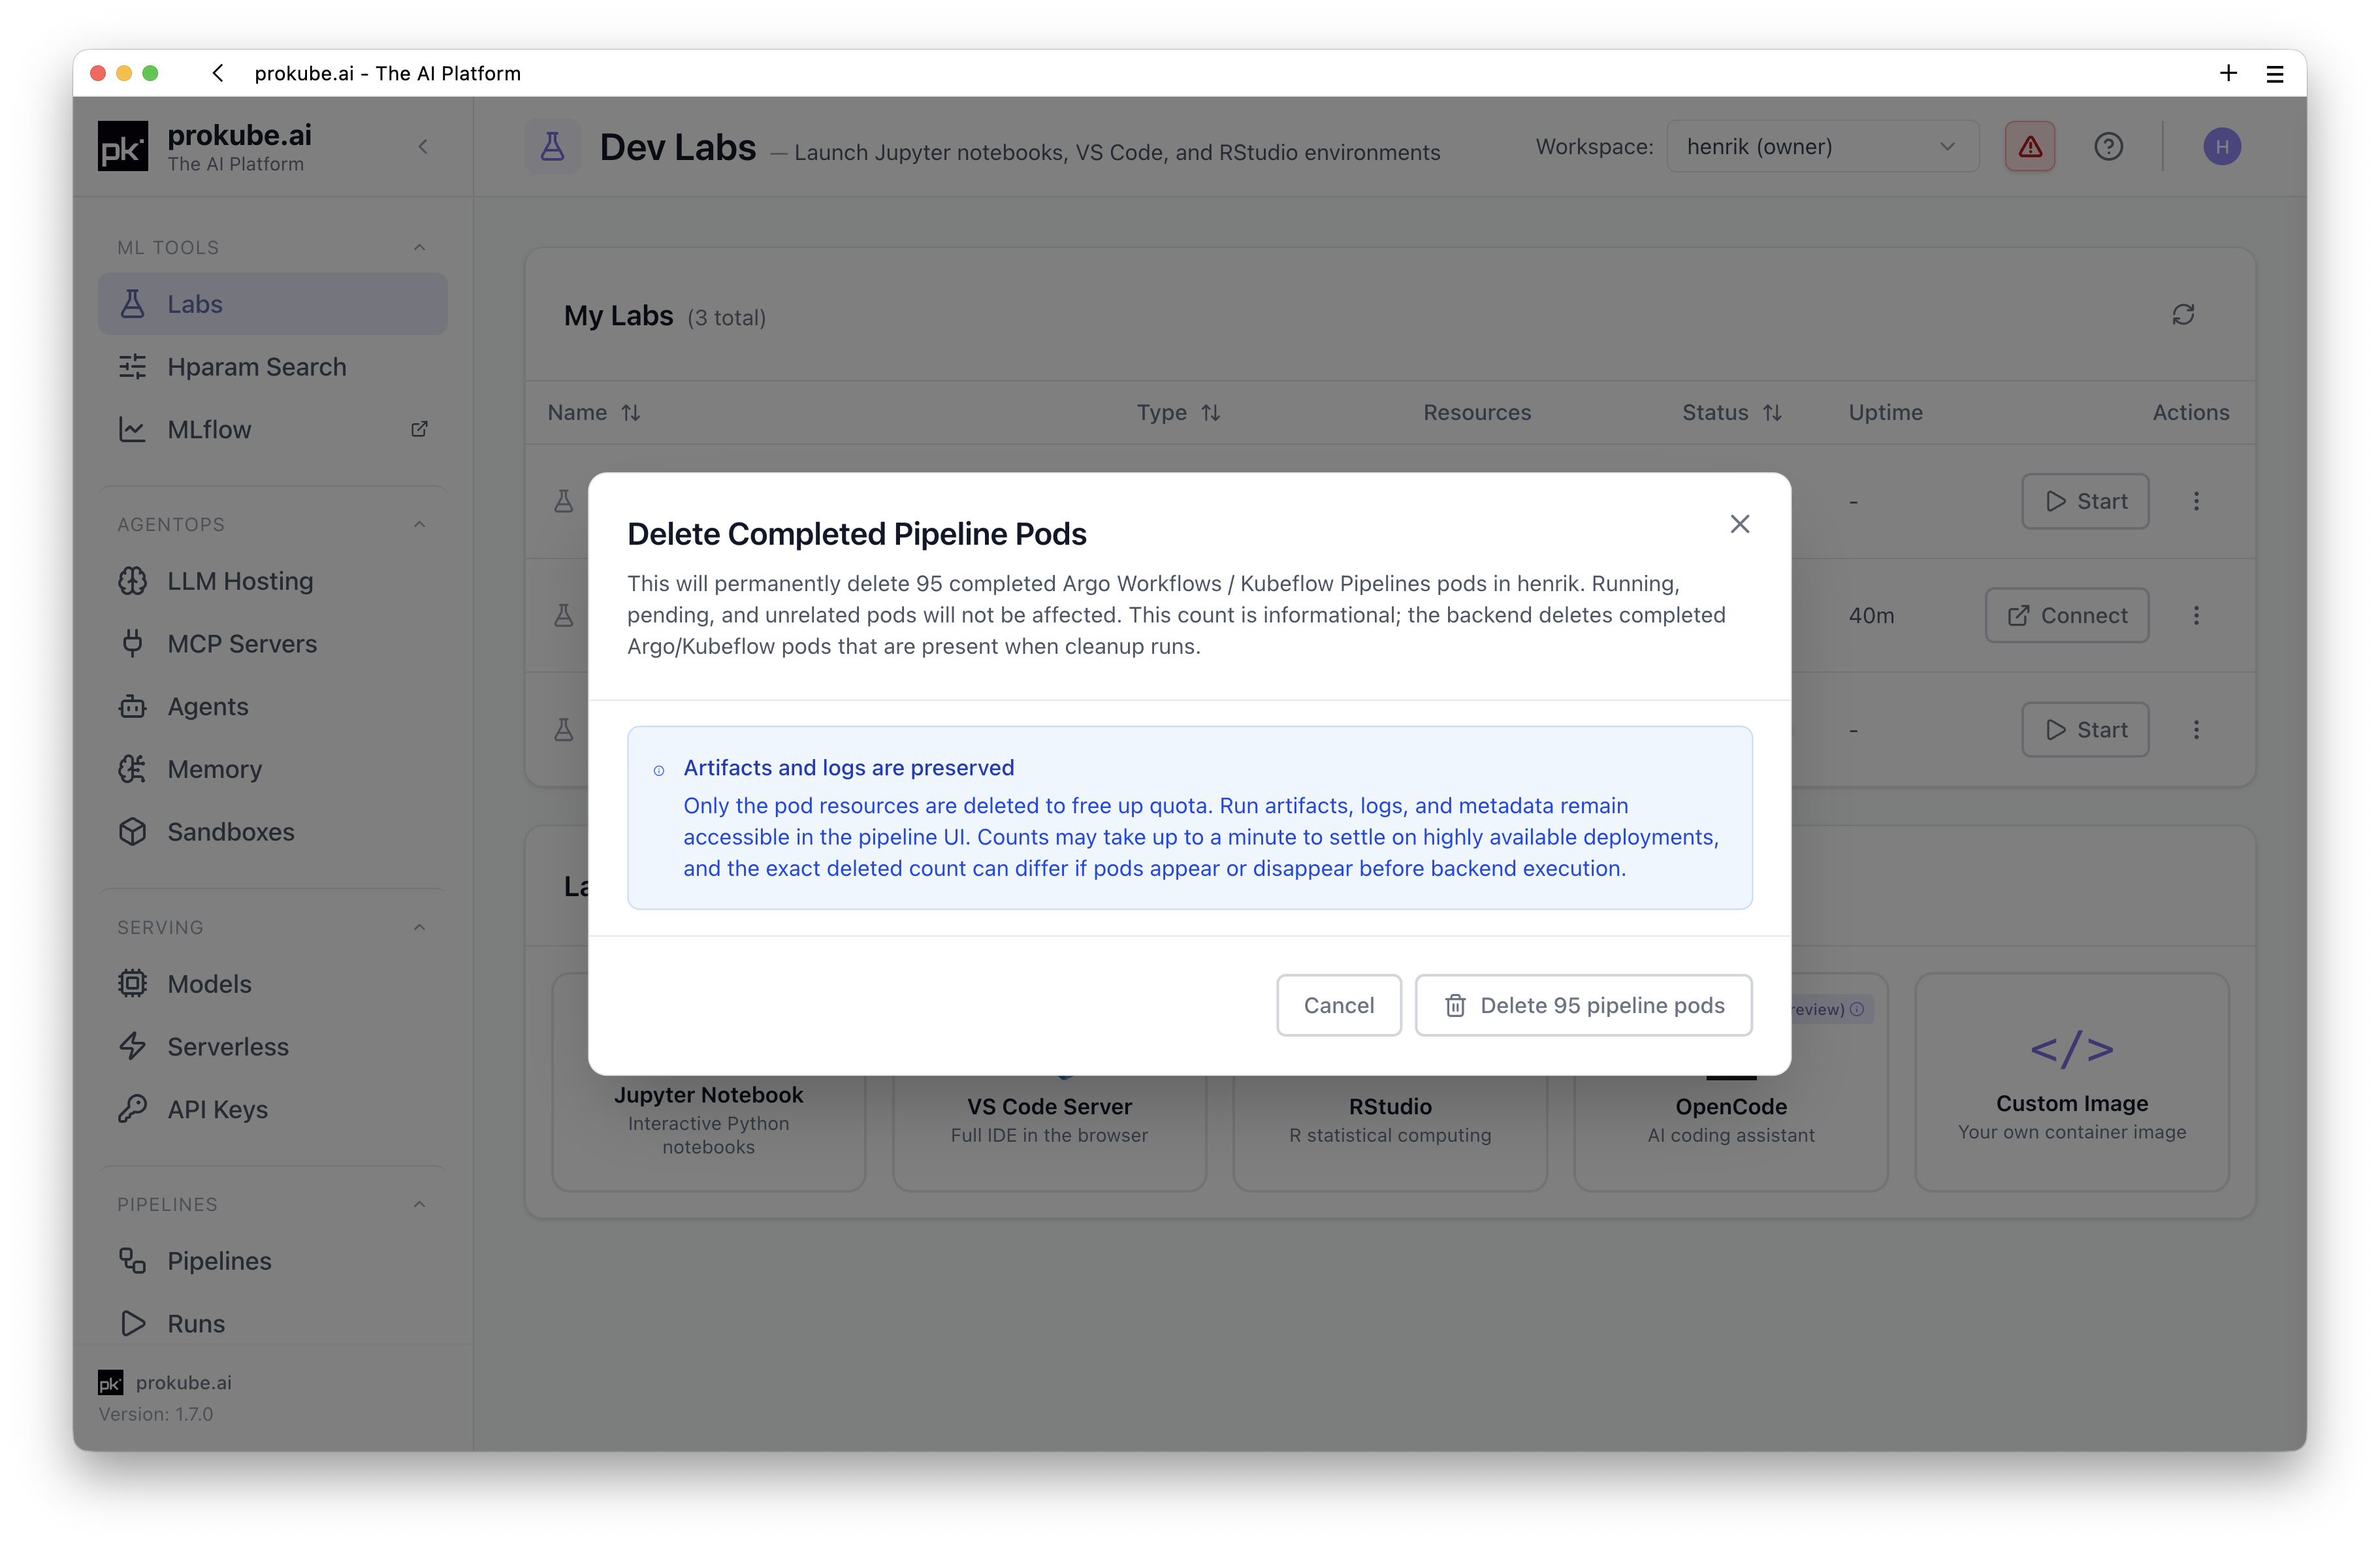
pkadmin is removed in 1.9. You download a kubeconfig from the user menu, add
registry credentials in a dialog, and when completed pipeline pods pile up, the
UI offers to clean them up. Most users will not need a terminal for any of
this anymore. We also closed the issue "pkadmin's -n flag is confusing". I
agree, and it is not a problem now.
We'll miss pkadmin, but spoiler alert: we are already working
on a prokube CLI for users, which among other things will manage agent
sandboxes.
The first release with agents
Until now, prokube was mostly about classic ML: notebooks, pipelines, experiment tracking and model serving. 1.9 is the first release where agents are part of the platform too. You can build agents with kagent, an open-source agent runtime for Kubernetes, connect them to tools and memory, and call them from your own applications. Tools come from MCP servers, which use the Model Context Protocol, a common standard for connecting agents to tools and data. The Agents docs walk you through building your first agent in the UI.
Building one agent for a demo is not that hard. Running dozens of them for different teams is a different story: each of them needs access to models and tools, and someone has to decide who is allowed to call what. In 1.9, Agent Gateway and API keys take care of that.
Agent Gateway and API keys
This is the part I spent most of this release on, so I'll try not to get carried away.
About a year and a half ago, I added an FAQ entry to our old docs about a 401 Unauthorized from model endpoints. The answer was: send an x-api-key header
to get past an Istio EnvoyFilter, and ask your admin for the key if you cannot
read it from the cluster yourself. It worked, but only for model serving, and
only with a key you did not control.
In 1.9, all programmatic access goes through Agent Gateway, which we build on the open-source agentgateway project and the Kubernetes Gateway API. In June, Henrik's map through the gateway confusion promised to tell you which gateway we picked. This is the one.
With the gateway in place, Labs and other workloads can call models, MCP servers and agents in their own workspace without an API key.
Calls from other workspaces are denied. From outside, clients use public routes like
/svc/ai, /svc/mcp and /svc/a2a and need a key.
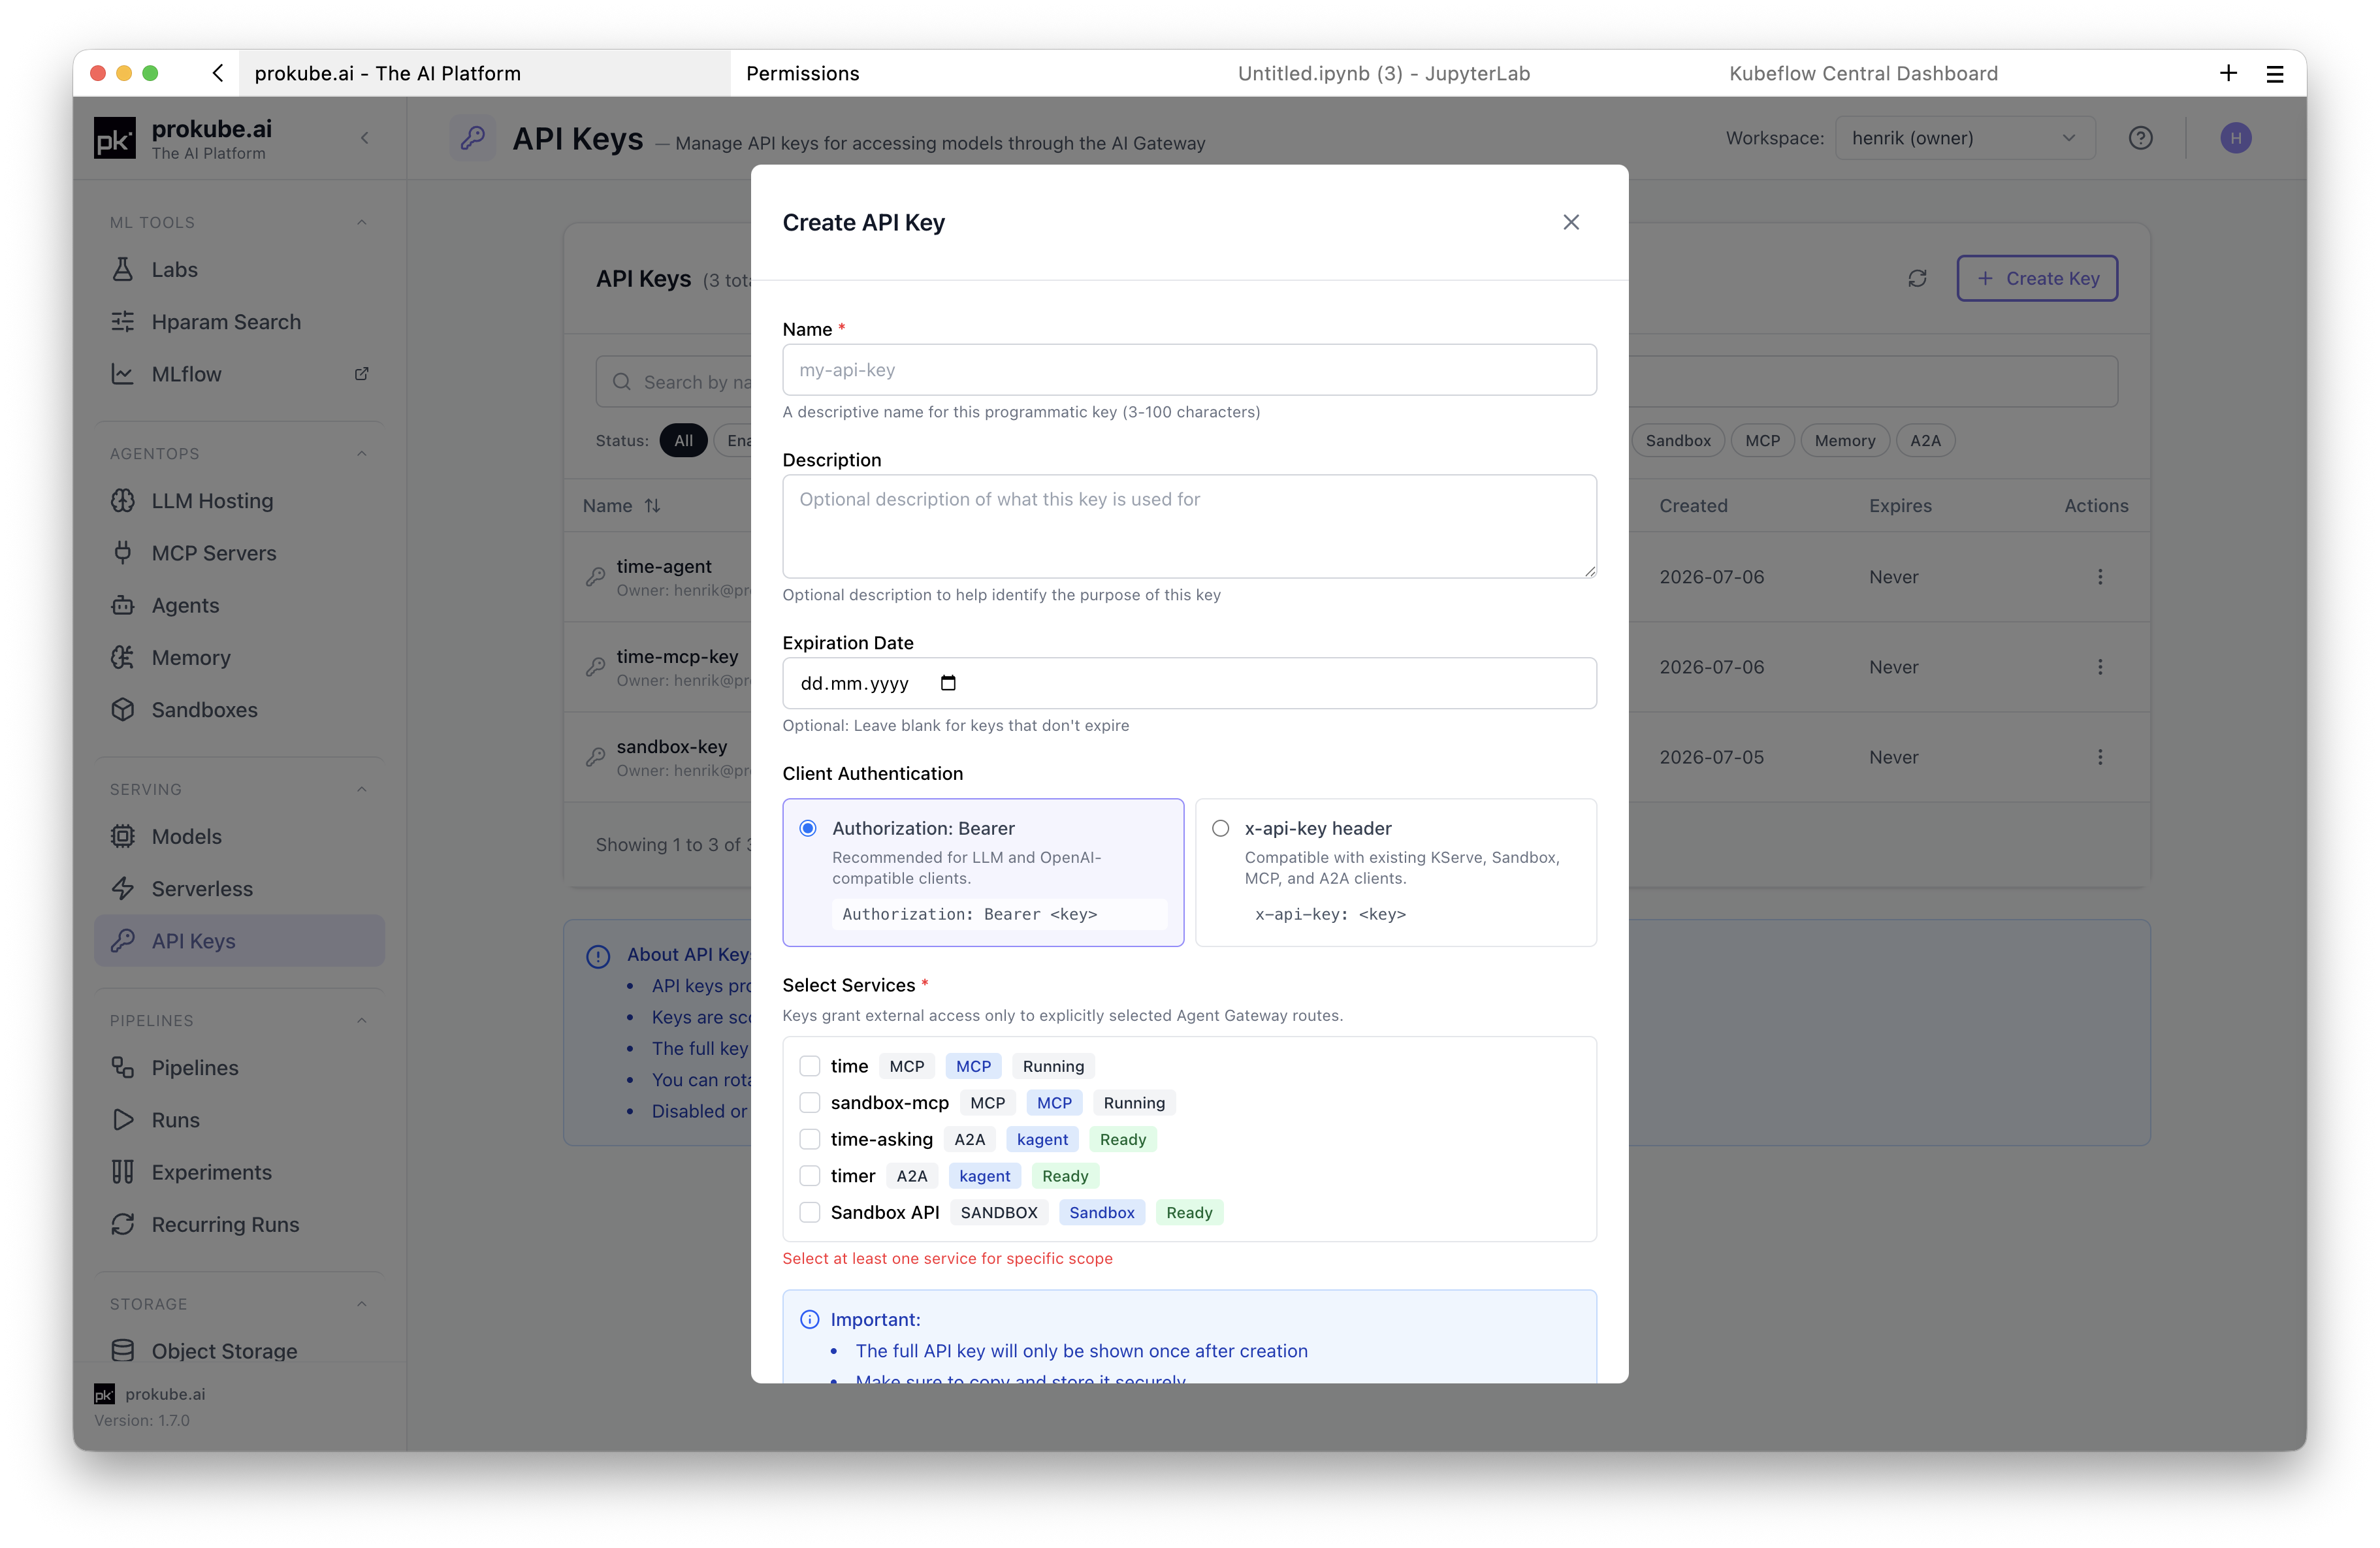
Users create keys themselves, and a key only covers what you select: one agent, a few MCP servers, all models in the workspace or everything.
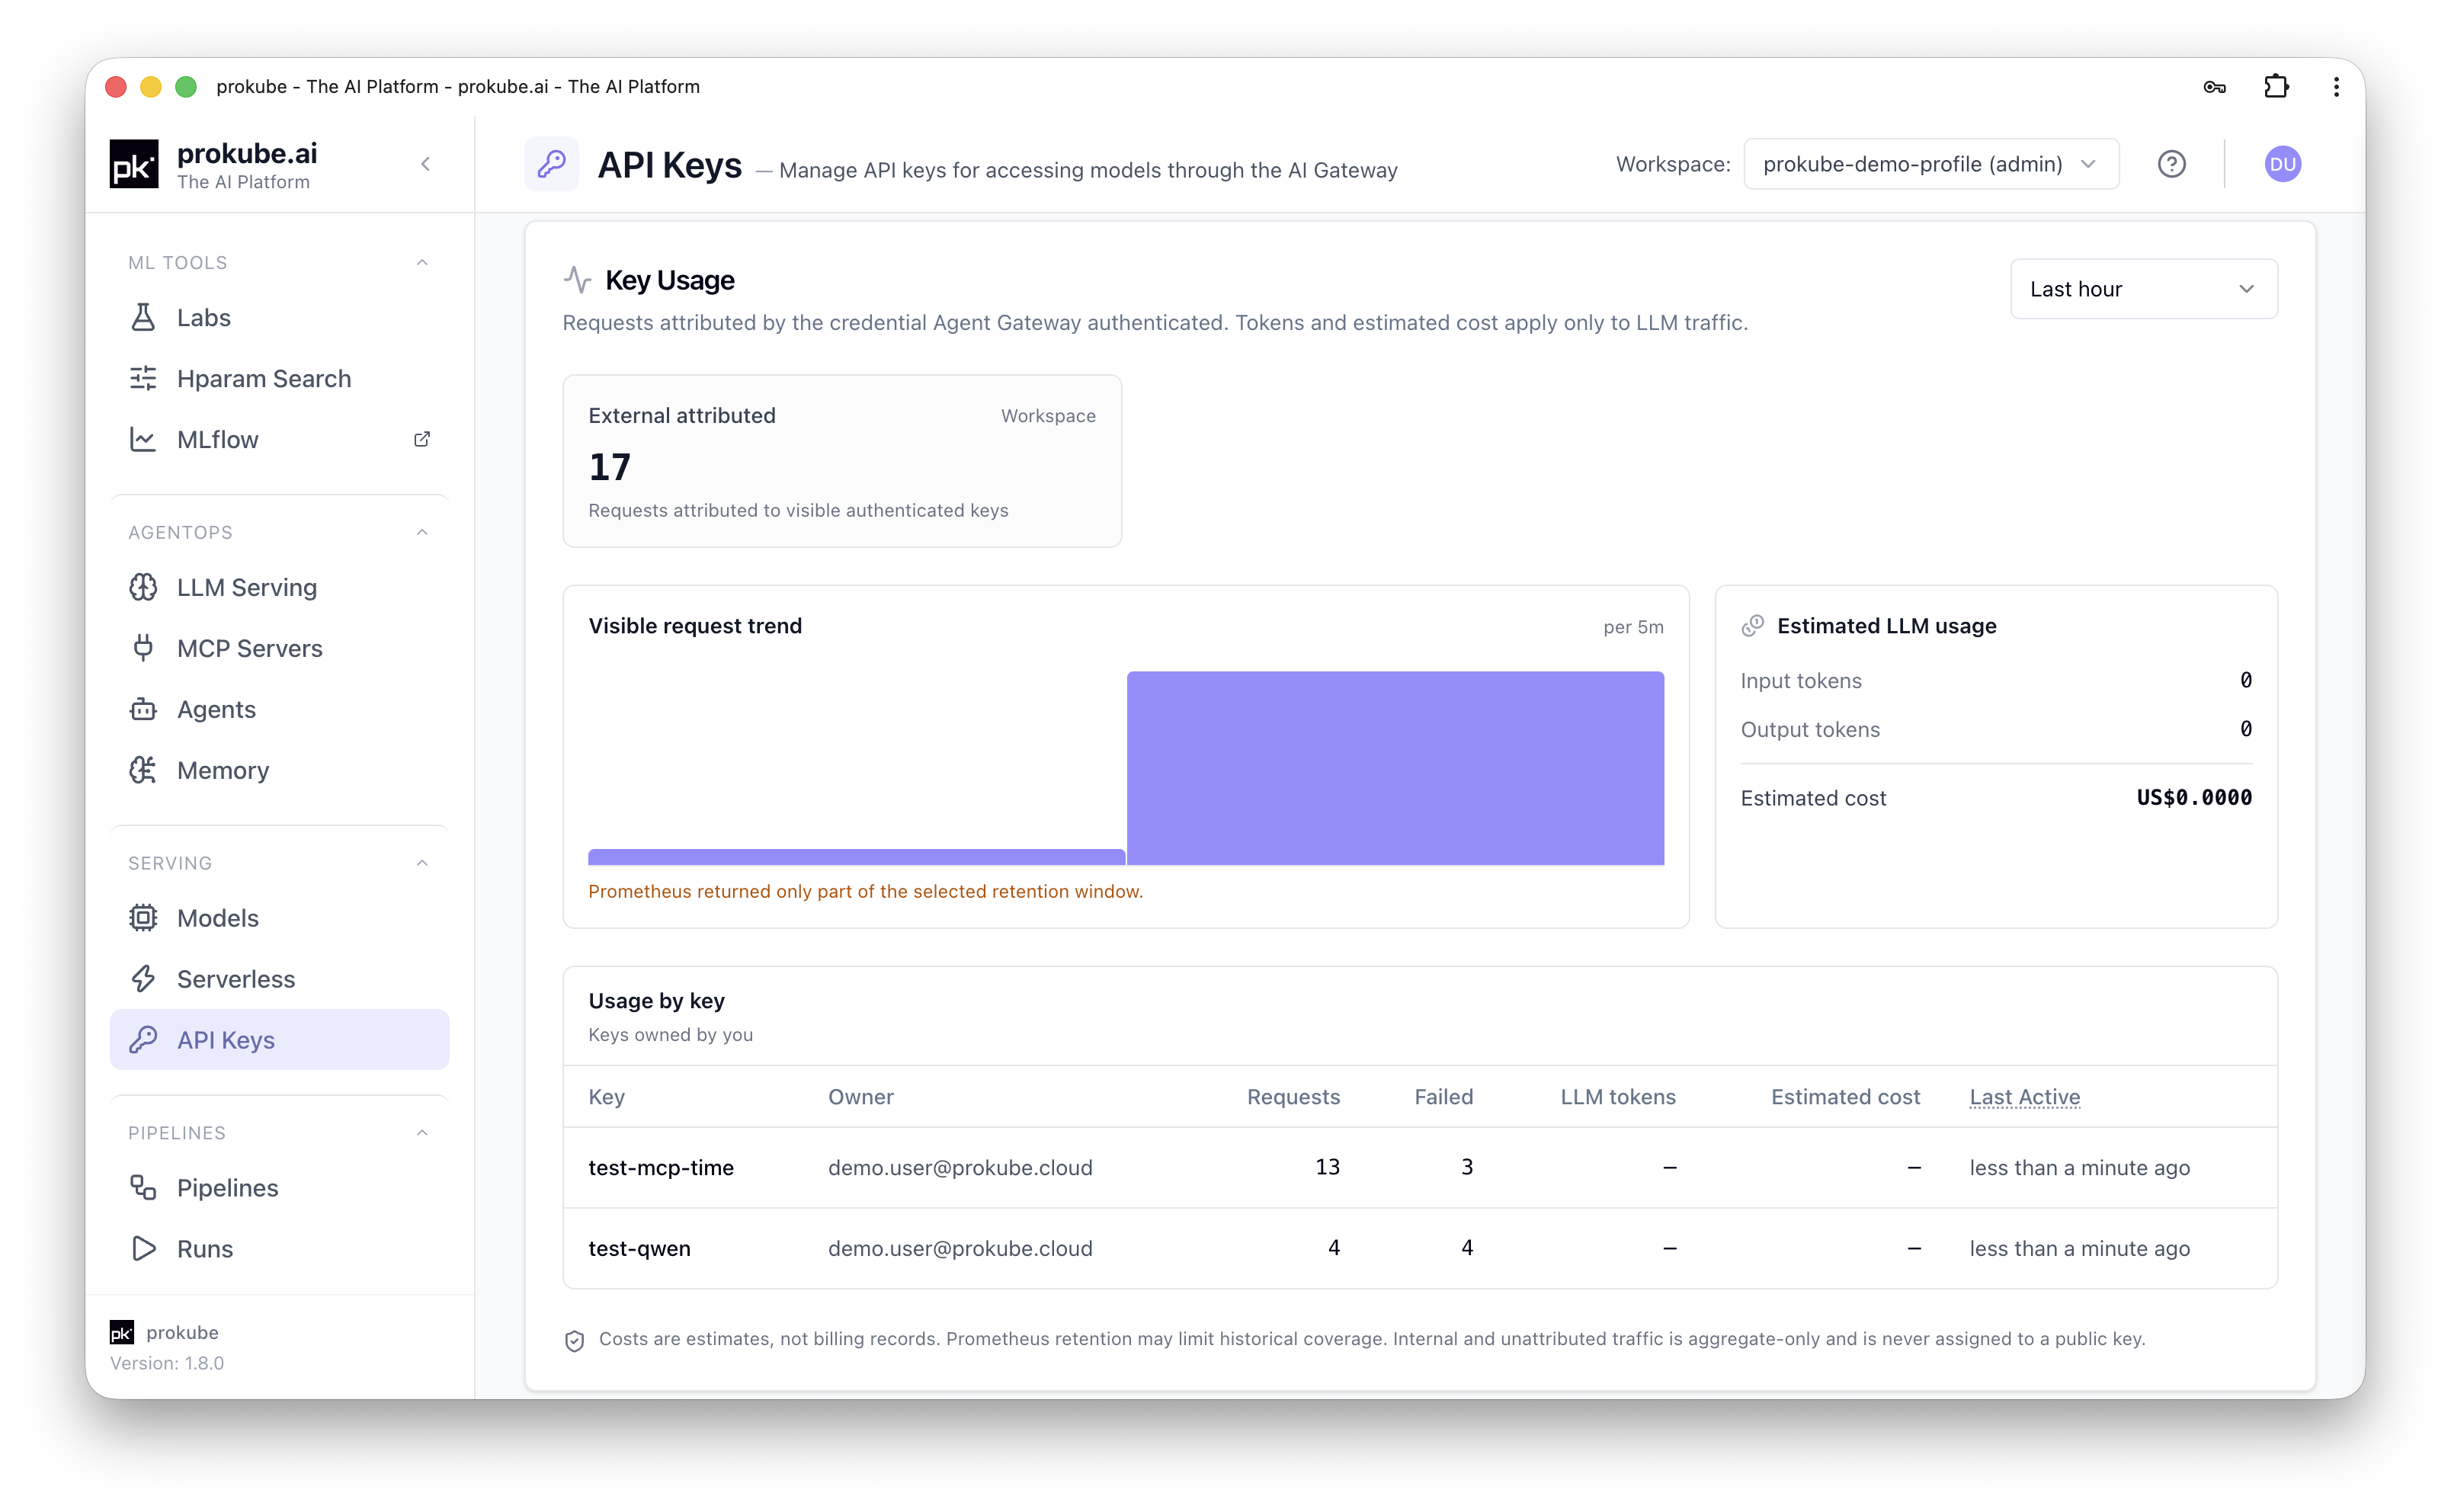
Since all traffic passes through one gateway, we can also show usage per key: requests, failures, LLM tokens and estimated cost. The cost is only an estimate, but it is usually enough to notice that a test script has been running all weekend.
Try it yourself
Our examples repository has notebooks you can run in a prokube Lab. Each README also explains the same steps from a terminal and from outside the cluster.
- The MCP server examples deploy the upstream Fetch MCP server and build a small custom FastMCP server that keeps Markdown notes.
- The kagent examples go from a basic agent to an agent with MCP tools, then to two agents working together, and finally to your own LangGraph agent.
Also in 1.9
A few more things in this release:
- Model serving: a shared vLLM 0.27.1 runtime, Qwen3.8 presets, a CPU runtime for embedding models and KServe deployments from PVCs as well as S3.
- Memory: agents can keep context between conversations in workspace Memory stores, either as a knowledge graph with Graphiti or as vector search with pgvector. Stores are exposed over MCP, so agents and external clients can use them, and the UI shows whether a store is healthy and keeping up with writes.
- Pipelines: you can compare runs with their metrics and open the latest run of a recurring pipeline directly.
- Security: access is checked per workspace, and if a check cannot be completed, the request is denied. Workspace viewers get read-only access.
- Operations: a new backup system based on Velero, deployments on GKE and OVH Public Cloud, and Ubuntu 24.04 as the default VM image.
The details are in the new prokube 1.9 documentation. If you run prokube and want help with the upgrade, or just want to tell us what is still missing, get in touch. Our tracker is never empty, but at least now it is a bit shorter.